
Recommendation
Molecular markers have drastically changed and improved our understanding of biological processes. In combination with PCR, markers revolutionized the study of all organisms, even tiny insects, and eukaryotic pathogens amongst others. Microsatellite markers were the most prominent and successful ones. Their success started in the early 1990s. They were used for population genetic studies, mapping of genes and genomes, and paternity testing and inference of relatedness. Their popularity is based on some of their characteristics as codominance, the high polymorphism information content, and their ease of isolation (Schlötterer 2004). Still, microsatellites are the marker of choice for a range of non-model organisms as next-generation sequencing technologies produce a huge amount of single nucleotide polymorphisms (SNPs), but often at expense of sample size and higher costs.
The high level of polymorphism of microsatellite markers, which consist of one to six base-pair nucleotide motifs replicated up to 10 or 20 times, results from slippage events during DNA replication. Short hairpin loops might shorten the template strand or extend the new strand. However, such slippage events might occur during PCR amplification resulting in additional bands or peaks. Such stutter alleles often appear to differ by one repeat unit and might be hard to interpret but definitively reduce automated scoring of microsatellite results.
A standalone software package available to handle stuttering is Microchecker (van Oosterhout et al., 2004, which nowadays faces incompatibilities with updated versions of different operating systems. Thus, de Meeûs and Noûs (2022), in their manuscript, tackled the stuttering issue by developing an OS-independent analysis pipeline based on standard spreadsheet software such as Microsoft Office (Excel) or Apache Open Office (Calc). The authors use simulated populations differing in the mating system (pangamic, selfing (30%), clonal) and a different number of subpopulations and individuals per subpopulation to test for differences among the null model (no stuttering), a test population with 2 out of 20 loci (10%) with stuttering, and the latter with stuttering cured. Further to this, the authors also re-analyse data from previous studies utilising organisms differing in the mating system to understand whether control of stuttering changes major parameter estimates and conclusions of those studies.
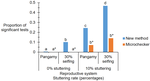
Stuttering of microsatellite loci might result in increased heterozygote deficits. The authors utilise the FIS (inbreeding coefficient) as a tool to compare the different treatments of the simulated populations. Their method detected stuttering in pangamic and selfing populations, while the detection of stuttering in clonal organisms is more difficult. The cure for stuttering resulted in FIS values similar to those populations lacking stuttering. The re-analysis of four previously published studies indicated that the new method presented here is more accurate than Microchecker (van Oosterhout et al., 2004) in a direct comparison. For the Lyme disease-transmitting tick Ixodes scapularis (De Meeûs et al., 2021), three loci showed stuttering and curing these resulted in data that are in good agreement with pangamic reproduction. In the tsetse fly Glossina palpalis palpalis (Berté et al., 2019), two out of seven loci were detected as stuttering. Curing them resulted in decreased FIS for one locus, while the other showed an increased FIS, an indication of other problems such as the occurrence of null alleles. Overall, in dioecious pangamic populations, the method works well, and the cure of stuttering improves population genetic parameter estimates, although FST and FIS might be slightly overestimated. In monoecious selfers, the detection and cure work well, if other factors such as null alleles do not interfere. In clonal organisms, only loci with extremely high FIS might need a cure to improve parameter estimates.
This spreadsheet-based method helps to automate microsatellite analysis at very low costs and thus improves the accuracy of parameter estimates. This might certainly be very useful for a range of non-model organisms, parasites, and their vectors, for which microsatellites are still the marker of choice.
References
Berté D, De Meeus T, Kaba D, Séré M, Djohan V, Courtin F, N'Djetchi KM, Koffi M, Jamonneau V, Ta BTD, Solano P, N’Goran EK, Ravel S (2019) Population genetics of Glossina palpalis palpalis in sleeping sickness foci of Côte d'Ivoire before and after vector control. Infection Genetics and Evolution 75, 103963. https://doi.org/0.1016/j.meegid.2019.103963
de Meeûs T, Chan CT, Ludwig JM, Tsao JI, Patel J, Bhagatwala J, Beati L (2021) Deceptive combined effects of short allele dominance and stuttering: an example with Ixodes scapularis, the main vector of Lyme disease in the U.S.A. Peer Community Journal 1, e40. https://doi.org/10.24072/pcjournal.34
de Meeûs T, Noûs C (2022) A simple procedure to detect, test for the presence of stuttering, and cure stuttered data with spreadsheet programs. Zenodo, v5, peer-reviewed and recommended by PCI Zoology. https://doi.org/10.5281/zenodo.7029324
Schlötterer C (2004) The evolution of molecular markers - just a matter of fashion? Nature Reviews Genetics 5, 63-69. https://doi.org/10.1038/nrg1249
van Oosterhout C, Hutchinson WF, Wills DPM, Shipley P (2004) MICRO-CHECKER: software for identifying and correcting genotyping errors in microsatellite data. Molecular Ecology Notes 4, 535-538. https://doi.org/10.1111/j.1471-8286.2004.00684.x
DOI or URL of the preprint: https://zenodo.org/record/6822544
Version of the preprint: v2
 , posted 15 Aug 2022
Dear Authors, the two reviewers of the manuscript during the first round of review are quite convinced about your revision and have just minor issues to be corrected. However, a third reviewer who was not available during the first round of review ios also quite convinced but has two issues that could be addressed or at least commented on, 1. the integration of analysis into R incl. an example for a binomial test on two alleles, and 2. a concern related to your simulations and conclusions related to strictly clonal populations. I would be grateful if you could address these smaller issues.
Kind regards
Michael Lattorff
The authors have substantially modified the manuscript. I found the updated version, which is significantly shorter, much easier to read. A few adjustments in the abstract, introduction and conclusion also better highlight the strengths of the proposed tool.
The authors have also very carefully taken into account the comments from the two reviewers and I found their responses to the several questions or criticisms convincing.
I just recommend the authors to check the new text parts for minor issues (e.g. line 672 of the version with track change: "occut" should be replaced by "occur"; "need being" is also written several times and I suppose it could be replaced by "need to be" or "will have to be", etc.).
https://doi.org/10.24072/pci.zool.100122.rev21, 13 Jul 2022I have no further comment. The paper has been improved and made more compact. It has therefore gained in efficiency.
https://doi.org/10.24072/pci.zool.100122.rev22This manuscript by Dr. T. De Meeûs presents and details a new implementation to test for stuttering pattern among microsatellite locus.
This manuscript is a revision. I did not take part in the first round of review. I have read the revised file and found it to be worthy of recommendation as it addresses an important topic for empirical population genetic studies and is a valuable contribution with the proposed methodology. I have also read the author’s response letter and found that the author has convincingly addressed all the concerns raised by the previous reviewers (Dr Thibaut Malausa and Dr. Thierry Rigaud). I do, however, have a few additional comments and suggestions that might help to further improve the article.
Both reviewers and the authors agree to state that microsatellites are (still) powerful markers to conduct sound population genetic study. One of the strength of microsatellite lies especially in the amount of information we have on the putative bias linked to empirical data acquisition and how to correct for these biases in appropriately curing the data. This curating step (according to relevant procedures) it is at utmost importance in order to perform accurate inference in population genetics. The opinions of the two reviewers diverge on how the method proposed can be applied to genomic data. I agree that it is important that the proposed method be versatile enough to be applied to a handful of microsat markers analyzed on an Excel sheet but also to a bio-informatic pipeline of NGS derived microsat typing. I was curious to test this procedure on my own data set, and even if I handled a reduced dataset I found more convenient to translate the procedure into the R language. I am not a skillfull R programmer, but I manage to write down a small script that do the job quite well, I think. It is convenient to use, as a starting point of this analyses, the output file generated by Genepop that summarize basic information, including the table of genotype frequencies, in the form:
Genotypes Obs. Expected
148 , 148 3 2.1801
151 , 148 1 2.1801
151 , 151 2 0.4845
Then in few lines on R it is possible to conduct the binomial test proposed by Dr. T. De Meeûs on the class of heterozygote genotypes that possess two alleles differing by only one repeat.
geno_table <- read.table("stutter_test.txt", header = T)
geno_table$diff = geno_table$geno1 - geno_table$geno2
range_repeats <- unique(geno_table$diff)
Obs <- vector(mode ="numeric", length = length(range_repeats))
Exp <- vector(mode ="numeric", length = length(range_repeats))
for (i in range_repeats) {
Obs[i+1] <- sum(geno_table[which(geno_table$diff==i),]$obs)
Exp[i+1] <- sum(geno_table[which(geno_table$diff==i),]$exp)
}
binom.test(c(round(Exp[2],0), Obs[2]), n=2, p=0.5)
May be it is possible to expand on it (it misses the loop on all locus across populations), but it could worth at least including these few lines in an appendix to the article. Hopefully, someone in the PCI forum will propose a R package but I am not sure it is mandatory for the use of this method in R.
My second main comment is more scientific. The main strength of the study by Dr. T. De Meeûs is to test the application of his method on simulated data generated after different reproductive modes. The method works very well for selfing, and it is clearly stated. The case of clonality is more puzzling, and I agree that even in the revised version it is still quite hard to follow. It could be worth stating in the introduction that this reproductive mode magnifies the effect of genetic drift due to the lack of segregation (Stoeckel & Masson, 2014; Reichel et al., 2016). This generate a large variability across loci that is indeed a pitfall for this stuttering test. With this respect, it is important to note that the author test the case of full clonal populations. The variability across loci is even magnified when considering mixture of clonal and sexual reproduction (clonal rate of 0.9 and above, Stoeckel & Masson 2014; Balloux et al., 2003). I am thus not convinced with the statement lines 632-634 (document with revision marks): “In partial clones, and given the lack of accuracy of the expected number of heterozygotes with one repeat difference, using the panmictic expectations will probably display better performances.” I think it is important for practical considerations that the author comment on that point or provide other simulation results.
For minor points see the annotated pdf that I upload with the review.
References cited
Reichel, K., Masson, J.-P., Malrieu, F., Arnaud-Haond, S., & Stoeckel, S. (2016). Rare sex or out of reach equilibrium? The dynamics of F IS in partially clonal organisms. BMC Genetics, 17(1). doi: 10.1186/s12863-016-0388-z
Stoeckel, S., & Masson, J.-P. (2014). The Exact Distributions of FIS under Partial Asexuality in Small Finite Populations with Mutation. PLoS ONE, 9(1), e85228. doi: 10.1371/journal.pone.0085228
Balloux, F., Lehmann, L., & Meeûs, T. de. (2003). The Population Genetics of Clonal and Partially Clonal Diploids. Genetics, 164(4), 1635–1644.
Download the review https://doi.org/10.24072/pci.zool.100122.rev23DOI or URL of the preprint: https://doi.org/10.5281/zenodo.5761550
, posted 23 Jun 2022Dear authors
we have now received two reviews on your manuscript. Both are positive, although one of the reviewers has some reservations. Please read the reviews carefully and refer to the points raised in your revision. Overall, both reviewers recommend shortening the text and bring out the added value.
We are looking forwward to receive your revcised version of the manuscript.
Kind regards,
Michael
This article presents and tests a method for the detection of stutters in microsatellite genotyping projects. It also benchmarks this method and a data correction method proposed by de Meeûs et al. 2019 using several datasets from several case studies.
The proposed detection method is exposed in details and the technical choices at each step of the design are well justified. The added value of the proposed tool is documented and this method represents a decent alternative to the software Microchecker developed in 2003 and proving more and more incompatible with most systems. As such, this method deserves publication and can be of interest for teams using microsatellites.
However, as reader and possible user of such method, I must acknowledge that I am not convinced that I would use or recommend the proposed tools. I agree that microsatellite markers are still cost-efficient and informative for a wide range of projects (although the frequency of their use has decreased over years). However, next-generation sequencing has considerably facilitated the design of microsatellite markers, enabling to be very exigent in terms of markers’ quality without spending much money. Hence, I am not sure that tools for stutter management are currently a top priority for most research teams. The other argument limiting my enthusiasm is related to the apparent ergonomy and extent of added-value of the tool. The advantage of the method is its simplicity and portability over operating systems. However, it does not seem straightforward to automatise it or incorporate it in a high-throughput workflow. If I am mistaken on this point, I would recommend to be more explicit in the ms about the possibilities of use of the tool. In terms of added-value, I found that overall the ms did not underline a large added-value provided by its use.
In terms of form of the article, I also think that the text could be much shortened to convert the ms into a short and smooth methodological paper. In my opinion, some elements of contexts and some detailed results and interpretations provide limited added-value while considerably complexifying the reading. Also, the text would probably be easier to read with a section pooling “Results & Discussion”: adding a small interpretation and “take-home message” after each section of the results would likely lead to little or no loss when compared to the current discussion, and it would avoid many repetitions and statements that are too far from the result section to be easily understood.
Finally, I have a series of remarks, suggestions and comments, listed below:
· L20-21: This statement does not look self-explanatory. This may be inserted and explained in the introduction but I would suggest to remove it from the abstract.
· L27-32: I found this summary of the results hard to follow. The statements “work well”, “not perfectly”, “improve parameters” or “behaviour of their variations” sound fuzzy. Referring to more detailed results (comparisons of a set of criteria or indices used to benchmark the methods) may be more informative and clear. I would suggest to re-write the second part of the abstract.
· L41-42: I see reasons why microsatellites are useful for non-model species, but why are they particularly useful for small organisms and vectors? This may be explained here.
· L43 : represent
· L48: kinds?
· L50-60: I wonder to what extent it is useful to make a focus on SNPs here. It kind of breaks the train of ideas while providing little added-value (the article is not really about comparing SSR to SNP and sequencing).
· L56-60: The idea is clear but this sentence may be reorganized to be easier to read.
· L60-65: I still do not understand why this is particularly true for parasitic organisms and their vectors. Many laboratories on many topics lack resources to carry out large genotyping projects. I would say that the constraint might be lower for laboratories working on species with high economic or health impact, so this would go against the statement in this sentence.
· L66: On ? (is it correct to write « Polymerase Chain Reaction of the targeted DNA strand”?)
· L83-88: I think it is not necessary to provide so many details. Stating that “Microchecker was developed in 2003 and displays incompatibility issues with most current systems” is sufficient to convince the readers.
· L114 : 10,000
· L120 : simulation
· L120 : 10,000
· L121-122: Why 20? Whenever possible, people usually try to genotype 30-40 samples to get more reliable estimates of population genetics indices.
· L134 : Identity
· L136-137: What are the reasons behind this choice?
· L138-139: When less than 20 alleles were present, how many loci were recoded? 2 or 10%?
· L139-140: This is probably not very important here, but in my experience, this is generally not the most realistic option. In general, stutters affect more than 10% of the alleles and sizes of stutters increase as the fragment size increases. Hence, most of the largest alleles are generally affected.
· L148: I do not think it is indispensable to keep the formula in French. Most readers are not interested in the formula in French and French readers will easily translate the formula.
· L158 : 10,000
· L197: Same remark as before: I do not see the interest of providing the formula in French
· L203-204: Same remark as before: I do not see the interest of providing the formula in French
· L209: Same remark as before: I do not see the interest of providing the formula in French
· L214: Same remark as before: I do not see the interest of providing the formula in French
· L220: Same remark as before: I do not see the interest of providing the formula in French
· L226-227: Same remark as before: I do not see the interest of providing the formula in French
· L297: At this stage, the reader can hardly remember what is BH. I suggest to be explicit. It will not increase much the size of the text and will be easier to read.
· L327: What is SAD?
· L331: Is it really obvious for the reader at this stage?
· L359: I suggest to remove “The performance of” as it implicitly sates that detecting stuttering is positive/successful while it is not the case under H0.
· L360: Placing comas around “respectively” may facilitate the reading
· L361: Reminding the H0 would help the reader here
· L363-364: See last comment: it would be better to be explicit earlier in the paragraph
· L370-372: This sounds already like a discussion. The previous paragraph was already clear and referring to Table 1 in this paragraph looks sufficient
· L382-383: Replace « the power to detect stuttering” by “stuttering detection”?
· L396: Again, the term « performance” seems to me misleading as it can be implicitly understood as a valuable property (while it is not under H0).
· L407: Replace « seemed” by “was”?
· L472-L486: I found this entire subsection “Clonal populations” is hard to follow. I think this comes from the first sentence that contains the statement “significant stuttering signature” that I do not find explicit; and at the end of the section I do not see as self-explanatory the fact that average FIS CI are consistent with the expectations
· L474-476: This second statement is relative to the H1 I suppose?
· L489-490 : This first sentence seems little useful
· L531-592: I find this section far too detailed. I would find it much more clear and convincing if it could be shorter with a focus on the qualitative/quantitative comparisons between the results obtained using the several methods.
· L540 : translate “Côte d’Ivoire”?
· L541: “authorS”?
· Discussion : in my opinion, this text would be much easier to read with a section pooling “Results & Discussion”. Overall, I think that adding a small interpretation and “take-home message” after each section of the results would result in little or no loss when compared to the current discussion, and it would avoid many repetitions and statements that are too far from the result section to be easily understood.
· L595: This statement is confusing (I also had the same feeling when reading the introduction): are we talking about the results under H0 (hence, this is a positive feature), under H1 (negative feature), or overall?
· L598: Reminding some results may be more convincing here
· L685: Who is JBR ?
https://doi.org/10.24072/pci.zool.100122.rev11, 06 May 2022Despite the rise of NGS and genomics, microsatellite genetic markers remain useful in population genetics studies. Due to their long-standing use, we now have an excellent perspective on the advantages and disadvantages of their use. One caveat of their usage is stuttering during the amplification process, which produces artificially alleles with one repeat difference, generating artificial heterozygote deficits in population genetics studies. This paper proposes a new method to detect stuttering in microsatellite data. This paper is an important contribution to the field because, as well described in the text, this new method is more efficient in most cases than the only tool presently available (MicroChecker). This study is therefore useful and timely.
The paper present the method, compare its efficiency with MicroShecker, but also examine consequences on various F statistics. This is done by a combination of simulations and tests on real datasets. The paper provide results of simulations for exploring the detection of stuttering, and answer the question: is the new method improve detection? The answer is often “yes”, but high proportions of false stuttering detections were found in clonal organisms. Then the consequences of stuttering of F statistics in population genetics (FIS, FST) are explored. Interestingly, 10% stuttering induce significant deficit of heterozygotes, especially in populations with selfing, but stuttering do not influence occurrence of linkage disequilibrium between pairs of loci.
I found the paper well written (albeit sometimes a bit too detailed, see comments below) and methodology accurate. I only have few comments aiming to improve (I hope) the reading of the paper and the usage of the method. Please find below these comments:
1- My main comment is about the description of the alternative method, L. 190-260. Instead of the long and fastidious description of what and where paste the results from Fstat and formula, why not providing a template (or example) on an excel sheet as supplementary material? This would fit the paper tittle
2- The end of the first paragraph of the introduction is a kind of mix between different ideas economic impact of the non-model diseases / Constraints for developing genetic markers. It is a bit hard to follow. I would suggest rewriting and separate these two things.
3- L. 81. Please explain why a “global test might be more …/… robust”
4- L. 134: “identitiy” should be “identity”
5- L. 306-308, about curing data. I do not understand why this “otherwise” procedure is made here, but not in cases where alleles were less rare. In other words, why forcing the grouping with more than one repeat difference? Why not leave them as they are? (is it making a difference?)
6- L. 475-477. I think the sentence is not complete (the proportions increase, but why are they increasing?)
7- L. 532. I do not understand this beginning of sentence since the following sentence show that there are differences.
8- L. 557-561 (and in other examples). All these list of alleles are very specific. Can you please recall here the reference of where to find the data?
9- L. 640. Change “tried out” by “considered” (?)
10- L. 675. Remove “;”
https://doi.org/10.24072/pci.zool.100122.rev12