Recommendation
Insects exhibit a great diversity of life-history traits that often vary not only between species but also between populations of the same species (Flatt and Heyland, 2011). A better understanding of the variation in these traits can be of paramount importance when it comes to species of economic and agricultural interest (Wilby and Thomas, 2002). In particular, the control of the development and expansion of agricultural pests generally requires a good understanding of the parameters that favour the reproduction of these pests and/or the reproduction of the species used to control them (Bianchi et al., 2013; Gäde and Goldsworthy, 2003).
Parasitoid wasps of the genus Trichogramma are a classic example of insects involved in pest control (Smith, 1996). This genus comprises over 200 species worldwide, which have been used to control populations of a wide range of lepidopteran pests since the 1900s (Flanders, 1930; Hassan, 1993). Despite its common use, the egg-laying preference of this genus is only partially known. For example, all Trichogramma species are often thought to have positive phototaxis (or negative geotaxis) (e.g. Brower & Cline, 1984; van Atta et al., 2015), but comprehensive studies simultaneously testing this (or other) parameter among Trichogramma species and populations remain rare.
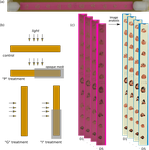
This is exactly the aim of the present study (Burte et al., 2021). Using a new experimental approach based on automatic image analysis, the authors compared the photo- and geo-tactic oviposition preference among 5 Trichogramma species from 25 populations. Their results first confirm that most Trichogramma species and populations prefer light to shade, and higher to lower positions for oviposition. Interestingly, they also reveal that the levels of preference for light and gravity show inter- and intraspecific variation (probably due to local adaptation to different strata) and that both preferences tend to relax over time.
Overall, this study provides important information for improving the use of Trichogramma species as biological agents. For example, it may help to establish breeding lines adapted to the microhabitat and/or growing parts of plants on which agricultural pests lay eggs most. Similarly, it suggests that the use of multiple strains with different microhabitat selection preferences could lead to better coverage of host plants, as well as a reduction in intraspecific competition in the preferred parts. Finally, this study provides a new methodology to efficiently and automatically study oviposition preferences in Trichogramma, which could be used in other insects with a particularly small size.
References
Bianchi, F. J. J. A., Schellhorn, N. A. and Cunningham, S. A. (2013). Habitat functionality for the ecosystem service of pest control: reproduction and feeding sites of pests and natural enemies. Agricultural and Forest Entomology, 15, 12–23. https://doi.org/10.1111/j.1461-9563.2012.00586.x
Burte V., Perez G., Ayed F., Groussier G., Mailleret L, van Oudenhove L. and Calcagno V. (2021). Up and to the light: intra- and interspecific variability of photo-and geo-tactic oviposition preferences in genus Trichogramma. bioRxiv, 2021.03.30.437671, ver. 4 peer-reviewed and recommended by PCI Zoology. https://doi.org/10.1101/2021.03.30.437671
Brower, J. H. and Cline, L. D. (1984). Response of Trichogramma pretiosum and T. evanescens to Whitelight, Blacklight or NoLight Suction Traps. The Florida Entomologist, 67, 262–268. https://doi.org/10.2307/3493947
Flanders, S. E. (1930). Mass production of egg parasites of the genus Trichogramma. Hilgardia, 4, 465–501. https://doi.org/10.3733/hilg.v04n16p465
Flatt, T. and Heyland, A. (2011). Mechanisms of life history evolution: the genetics and physiology of life history traits and trade-offs. Oxford University Press. https://doi.org/10.1093/acprof:oso/9780199568765.001.0001
Gäde, G. and Goldsworthy, G. J. (2003). Insect peptide hormones: a selective review of their physiology and potential application for pest control. Pest Management Science, 59, 1063–1075. https://doi.org/10.1002/ps.755
Hassan, S. A. (1993). The mass rearing and utilization of Trichogramma to control lepidopterous pests: Achievements and outlook. Pesticide Science, 37, 387–391. https://doi.org/10.1002/ps.2780370412
Smith, S. M. (1996). Biological Control with Trichogramma : Advances, Successes, and Potential of Their Use. Annual Review of Entomology, 41, 375–406. https://doi.org/10.1146/annurev.en.41.010196.002111
van Atta, K. J., Potter, K. A. and Woods, H. A. (2015). Effects of UV-B on Environmental Preference and Egg Parasitization by Trichogramma Wasps (Hymenoptera: Trichogrammatidae). Journal of Entomological Science, 50, 318–325. https://doi.org/10.18474/JES15-09.1
Wilby, A. and Thomas, M. B. (2002). Natural enemy diversity and pest control: patterns of pest emergence with agricultural intensification. Ecology Letters, 5, 353–360. https://doi.org/10.1046/j.1461-0248.2002.00331.x
I once again enjoyed reading the preprint “up and to the light: intra- and interspecific
variability of photo- and geotactic oviposition preference in genus Trichogramma” by
Burte et al. The abstract now reads well, and the reformulated sentences are now clear to me. The figures have better readability. The explanation of the delineation in line 425-426 add clarity. Figure S3 and Table S1 add to the interpretation of the data by the reader. Overall I agree with the changes made and the explanation given in the reply by the authors.
I found some small typo’s and other textual errors.
Line 89 remove “in” from developing in.
Line 181 ...impact on their tube temperature
Line 395 double period
Line 559 “Even though sampled for most of them only a few years before experiments...” suggested change to “Even though most populations were sampled only a few years before the experiments...”
Line 567 “ that have over 20 years, and the “young” ones that have only a couple of years” of lab adaptation or something similar should be added.
https://doi.org/10.24072/pci.zool.100008.rev21 , 13 Jul 2021
I really appreciated the changes made to the manuscript. In particular, it now has a more comprehensive introduction and theoretical discussion, which gives additional value to the reading.
I think the legend for the species is missing on the left PCA (Figure 5a)
L131: It should read "Palearctic"
L556: Remove extra column ";"
I encourage the authors to carefully go through their article one more time to spot minor typo errors.
https://doi.org/10.24072/pci.zool.100008.rev22DOI or URL of the preprint: https://doi.org/10.1101/2021.03.30.437671
, posted 11 May 2021Dear Dr Calcagno,
I have received the detailed comments of two reviewers on your manuscript entitled “Up and to the light: intra- and interspecific variability of photo- and geo-tactic oviposition preferences in genus Trichogramma". As you will see, both reviewers liked your study. I agree with them, in that your manuscript is pleasant to read and provides useful, novel and interesting data about the egg-laying behaviour of Trichogramma wasps.
Having said that, the reviewers raise numerous points that need to be addressed to improve the clarity of the text and strengthen the conclusions. Among them, I would like to stress the importance to provide more details about the lab rearing conditions of the tested populations. This would allow you to exclude that the reported results are simple by-products of standard laboratory conditions selecting for “up and to the light” egg-laying sites, thus strengthening the relevance of your results.
I look forward to reading your detailed responses to the numerous and detailed reviewers' comments, and the associated changes in the manuscript.
Best,
Joel Meunier
, 09 Apr 2021Review for PCI Zoology: Up and to the light: intra- and interspecific variability of photo- and geo-tactic oviposition preferences in genus Trichogramma
General comments:
I do not have many comments to make. I really appreciated reading this article. The protocol used to unravel the main effects of photo- and geotactic components is smart and allows obtaining good sample sizes.
Introduction: This part is well written but the end of the introduction would benefit from more detailed explanations. Especially in the last paragraph, it would be interesting that the authors write their hypotheses regarding expected inter-populational variations, and interspecific differences.
Results: I don't want to be a dogmatist, but the authors should be careful not discussing too much the results in this section. Of course, anything that helps understanding the results is welcome, but some paragraphs (e.g., P10L6-16 or P12L22-33) would better fit in the discussion section.
Discussion: In this section, I appreciated the efforts that the authors put in trying to explain interspecific differences in the observed patterns. It is a difficult task given the poor knowledge on natural history of some species. Would it be possible to discuss more about how other species- or population-dependent life history traits, such as size, mass, energetic reserves, flight capacities, longevity, egg-load, could affect the patterns observed in this study? In addition, what could be the links between microhabitat selection and microclimatic conditions found on/under the leaves? Finally, adding more details on the relevance of your work regarding inundative biocontrol strategies would be great.
Specific comments:
P2L6: Please write “Trichogramma brassicae” in full here, as it is the first time you mention the species in the text.
P2L8: I think it’s a bold statement to say that the ecology of trichograms is not well understood. Please temper this statement a little bit. However, I totally agree that the genetic, physiological, behavioral diversity of trichograms is not well understood.
P2L24-30: This paragraph is particularly well written and it gives a good idea of the importance of the work done in your study (and yet to be done). I would just suggest adding a short sentence to make clear that we also want to select particular parasitoid strains that fit the environment they will be released in. One cannot release a parasitoid strain that has poor cold resistance in Québec, for instance (see Gariepy, V., Boivin, G., & Brodeur, J. (2015). Why two species of parasitoids showed promise in the laboratory but failed to control the soybean aphid under field conditions. Biological Control, 80, 1–7. https://doi.org/10.1016/j.biocontrol.2014.09.006)
P3L22: Please write the genus name in full when it begins a sentence
P4L5: remove the “s” after “population”
P7L17: How closely? Please mention the R² of 95% here as well, before referring to Fig S1.
P9L12: Please remind what P and G treatments are, in the figure caption, so the figure is easier to understand.
P13L2: Please provide the % variance explained by each of the two axes. Moreover, please provide (as a supplementary figure) the contribution of each variable to each dimension.
In addition, would it be possible to try representing the PCA with confidence ellipses around each group (either species, or strata)? It would allow seeing more clearly how groups discriminate on the graph. Of course, I understand it’s not possible for n < 3.
P13L20-22: Of course, but I still think it’s worth of discussion; what could be the interplay, in nature, between geotactism and phototactism? Your results suggest additive effects, so maybe the neurological and sensorial mechanisms are totally dissociated between both attraction components? This is discussed a little bit in the following paragraph, but maybe some more references from the literature can be found regarding additive vs. synergic effects in other animal groups (or even in plants?).
P16L4-15: In this last paragraph, or elsewhere in the discussion, it could also be interesting to mention that life-history traits and behaviors often differ a lot between natural and industrial parasitoid strains. In a biological control perspective, it is, as you mention, extremely important to optimize the match between parasitoid strain and the environment (and, of course, the target pest species). Just to give you an example, but other exist, we explored this issue in Tougeron, K. et al. (2020). Trans-generational effects on diapause and life-history-traits of an aphid parasitoid. Journal of Insect Physiology, 121, 104001. https://doi.org/10.1016/j.jinsphys.2019.104001 and in Saeed, M. M. et al. (2020). Transgenerational phenotypic plasticity of diapause induction and related fitness cost in a commercial strain of the parasitoid Aphidius ervi Haliday. Insect Science, 1744-7917.12794. https://doi.org/10.1111/1744-7917.12794).
https://doi.org/10.24072/pci.zool.100077.rev11I have enjoyed reading the preprint up and to the light: intra- and interspecific variability of photo- and geotactic oviposition preference in genus Trichogramma by Burte et al. The oviposition preference of Trichogramma wasps is important for successful biocontrol applications as the biocontrol agent (Trichogramma) and pests (mostly Lepidoptera) can be matched and the mass-rearing of the agent can be made more efficient. As the Trichogramma genus is a species rich genus, and the number of cryptic species is high, it is important to study phenotypic traits on a large scale to be able to study many species/populations but reduce the time spend. The authors present a high-throughput system for recording and automatically analysing the location of oviposition of many wasps at the same time during a number of days. Using this system they tested the whether 25 populations of 5 species of Trichogramma have a preference to oviposit more to the top of the tube or whether they oviposit in the light vs in the dark.
General comments
The authors take care not to stretch their interpretations beyond the results they obtained and in general do a good job of discussing the limitations of their research. As this is partly a methodology paper, introducing the method is important and although the authors do a good job overall, I do have some questions and remarks (see below). The strains / species / populations used in the study are all established in the lab for multiple years, some longer than others. However the authors do not report how the lines were maintained in the lab for all those years? Where they horizontal or vertical in the incubators? Was the light distribution equal? In terms of adaptation to the original stratum, is it not expected that any preference based on stratum height would have been lost after so many years in the lab?
In the manuscript results are often given for a certain notable population or species in terms of phenotype, but the data for all populations is not given in the supplementary. The entire raw dataset and associated information are not available online yet, as no link is given to them. It is hard to evaluate all results in this way. For example, the preference scores per day (Fig. 3) are only given for one population, and Fig. 3b is not informative for the different populations / species or treatment but only gives an overall picture. Also the distribution of parasitism rates in the separate tubes is only given for one population (Fig. S3).
The notion that the observed plasticity of the preference over the five days could be due to host shortage is refuted by the authors themselves as the overall parasitism rate is low. However, it is not clear to me if this overall parasitism rate is measured across the entire tube, or is measured for the prefered sites? This should be made more clear in the text, and would also be aided by additional figures in the supplementary or online (see above).
The authors also refer to Trichogramma wasps as trichograms throughout the text. This is a new one for me, and upon searching this name I could only find a medical examination with the same name. I would suggest the authors to change trichograms into Trichogramma wasps, unless they have a good reason not to? I also had a hard time connecting the population names to the species throughout the text, especially when refering from the text to the figures and back again. It would help to have the species names in Figure 2 as well (maybe in a 90 deg. angle, between populations label and the population names), and in the text each time a general remark is made about a Trichogramma species result to indicate the color in parenthesis.
Please have continuous line numbering for the entire manuscript, that is easier.
Abstract
The English in the abstract reads a little bit ackward and could use the help of a native English reader to finetune it.
“Appropriate” in the third sentence does not clearly refer to biocontrol agent.
Line 22-25 should be rephrased as it is a too complex sentence.
Introduction
The introduction generally reads pleasantly, however a clear rationale for the study does not entirely emerge from the introduction. A bit more background on the relation between the Lepidoptera host species and Trichogramma species would be helpful, e.g. does the oviposition site of a certain Lepidoptera species have a relation with the preference of the Trichogramma species for light and geotaxis?
In addition, what was the reason for studying the 5 Trichogramma species chosen here? Availability? Or are they hypothesized to be clearly distinct in their phenotypes? The introduction does not give a clear direction for the species tested, only somewhat for the rationale of looking at oviposition.
Page 2
Paragraph starting at line 32 is a bit vague also with respect to the traits that are “adaptively important”. It is a bit difficult to figure from the text exactly which traits are meant, and “adaptively important” is a strange sentence construction. Please rewrite this to make it more concrete what is meant here.
Line 42-43 has an awkward sentence construction.
Line 44: to what other purposes is referred here?
Material and methods
It is unclear how many replicates were done per population, only later in the results I could read that it was 40 tubes per population. Please add this information to the M&M.
Was the light intensity equal along the 2*20 grid of tubes? It is not indicated that this is measured.
Page 4
Table 1: Does >2014 mean that it was sampled after 2014? Or do the authors mean <2014?
Line 11: disposed >> distributed or glued
Line 13-14: I assume that the Trichogramma inocula were glued to the cardboard also to enable vertical positioning of the tubes. What type of glue was used? And were the honey droplets soaked up by the cardboard? Else it would not have stayed in place in the vertical position?
Line15: is >> in
Line 16: disposed >> placed
Page 5
Line 18: There is no “H” treatment? I guess this should be “P”.
Page 6
Figure 1: In the figure and caption the pictures are referred to as J1 to J5 but in the text these are D1 to D5. Please change in the Figure and caption to D as well.
Page 7
Line 7: dark
Line 30-33 is a hard to read sentence. I also would advice to add the formula’s used to calculate the different values plotted and used in the statistical analyses.
Line 41-42: I don’t understand what is meant here.
Page 8
I’m not an expert in statistics so I cannot properly evaluate the method described in lines 5-20. But I wonder why the square root of nbT is used to weigh against? Please give a rationale for this choice.
Results
Line 32: Add in the text that the failed or male-only hatching refers to the eight parasitized Trichogramma inocula placed in the middle of the card strip.
Page 9
Figure 2: The asterix and axis font could be a bit bigger, and the dark frames are very hard to see compared to the boxes without frame. Maybe a colored pattern in the bars would help.
Page 10
Line 11: are the parasitism rates referred to here overall or per patch (disk of eggs?) Because even if the overall parasitism rate was low, if the preferred patch was fully parasitized it could explain the plasticity observed. However it is not clear from the text exactly what could be the case here.
On page 11, paragraph starting at line 17 also refers to the depletion effect, and also here I would have appreciated to see the distribution of parasitism along the patches.
Page 12
Line 4: Please give the percentage of explaned variance per component.
Line 5: It is stated that the first PC1 axis separates populations with strong preference from those with weak preference or no preference, however populations on the right hand side of PC1 could also be contrasting in their preference for P and G, as is the case for pr002.
Line 18: I don’t agree with the statement entirely, it is true that T. principium is attracted to the light based on the date, but only one of the two populations of T. brassiceae, so the phrasing of this sentence should be a bit different.
In addition, the significant difference of P score across species is not something I see reflected in Fig. 5? Please explain.
Page 13
Figure 5b: indicate that grey circles are populations without stratum data.
Discussion
Page 14
Line 5: away >> a way
Line 8-10: The statement here may be true for isa1729, but population f5-11 does not seem to suffer from this non-additive effect because of the strength of the preference for the single-cues? So the generality of the statement here is not accurate. Please explain.
Line 23: remove “numbers”.
Line 24: Overall low parasitism rate is not informative as it has to do with the percentage parasitism at the prefered site, but this is not given in Fig. S2.
Line 42: Please explain thigmotaxis
Page 15
Line 9-11: Sentence construction is a bit awkward. Please change within >> when
Line 28: Why would there be a stronger association of light preference with population from the herbaceous layer , and why would this make sense from an adaptive perspective?
https://doi.org/10.24072/pci.zool.100077.rev12
