
Recommendation
 based on reviews by 2 anonymous reviewers
Human African Trypanosomiasis (HAT), or sleeping sickness, is caused by trypanosome parasites. In sub-Saharan Africa, two forms are present, Trypanosoma brucei gambiense and T. b. rhodesiense, the former responsible for 95% of reported cases. The parasites are transmitted through a vector, Genus Glossina, also known as tsetse, which means fly in Tswana, a language from southern Africa. Through a blood meal, tsetse picks up the parasite from infected humans or animals (in animals, the parasite causes Animal African Trypanosomiasis or nagana disease). Through medical interventions and vector control programs, the burden of the disease has drastically reduced over the past two decades, so the WHO neglected tropical diseases road map targets the interruption of transmission (zero cases) for 2030 (WHO 2022).
Meaningful vector control programs utilize traps for the removal of animals and for surveillance, along with different methods of spraying insecticides. However, in existing HAT risk areas, it will be essential to understand the ecology of the vector species to implement control programs in a way that areas cleared from the vector will not be reinvaded from other populations. Thus, it will be crucial to understand basic population genetics parameters related to population structure and subdivision, migration frequency and distances, population sizes, and the potential for sex-biased dispersal. The authors utilize genotyping using nine highly polymorphic microsatellite markers of samples from Chad collected in differently affected regions and at different time points (Ravel et al., 2023). Two major HAT zones exist that are targeted by vector control programs, namely Madoul and Maro, while two other areas, Timbéri and Dokoutou, are free of trypanosomes. Samples were taken before vector control programs started.
The sex ratio was female-biased, most strongly in Mandoul and Maro, the zones with the lowest population density. This could be explained by resource limitation, which could be the hosts for a blood meal or the sites for larviposition. Limited resources mean that females must fly further, increasing the chance that more females are caught in traps.
The effective population densities of Mandoul and Maro were low. However, there was a convergence of population density and trapping density, which might be explained by the higher preservation of flies in the high-density areas of Timbéri and Dokoutou after the first round of sampling, which can only be tested using a second sampling.
The dispersal distances are the highest recorded so far, especially in Mandoul and Maro, with 20-30 km per generation. However, in Timbéri and Dokoutou, which are 50 km apart, very little exchange occurs (approx. 1-2 individuals every six months). A major contributor to this is the massive destruction of habitat that started in the early 1990s and left patchily distributed and fragmented habitats. The Mandoul zone might be safe from reinvasion after eradication, as for a successful re-establishment, either a pair of a female and male or a pregnant female are required. As the trypanosome prevalence amongst humans was 0.02 and of tsetse 0.06 (Ibrahim et al., 2021) before interventions began, medical interventions and vector control might have further reduced these levels, making a reinvasion and subsequent re-establishment of HAT very unlikely. Maro is close to the border of the Central African Republic, and the area has not been well investigated concerning refugee populations of tsetse, which could contribute to a reinvasion of the Maro zone. The higher level of genetic heterogeneity of the Maro population indicates that invasions from neighboring populations are already ongoing. This immigration could also be the reason for not detecting the bottleneck signature in the Maro population.
The two HAT areas need different levels of attention while implementing vector eradication programs. While Madoul is relatively safe against reinvasion, Maro needs another type of attention, as frequent and persistent immigration might counteract eradication efforts. Thus, it is recommended that continuous tsetse suppression needs to be implemented in Maro.
This study shows nicely that an in-depth knowledge of the processes within and between populations is needed to understand how these populations behave. This can be used to extrapolate, make predictions, and inform the organisations implementing vector control programs to include valuable adjustments, as in the case of Maro. Such integrative approaches can help prevent the failure of programs, potentially saving costs and preventing infections of humans and animals who might die if not treated.
References
Ibrahim MAM, Weber JS, Ngomtcho SCH, Signaboubo D, Berger P, Hassane HM, Kelm S (2021) Diversity of trypanosomes in humans and cattle in the HAT foci Mandoul and Maro, Southern Chad- Southern Chad-A matter of concern for zoonotic potential? PLoS Neglected Tropical Diseases, 15, e000 323. https://doi.org/10.1371/journal.pntd.0009323
Ravel S, Mahamat MH, Ségard A, Argiles-Herrero R, Bouyer J, Rayaisse JB, Solano P, Mollo BG, Pèka M, Darnas J, Belem AMG, Yoni W, Noûs C, de Meeûs T (2023) Population genetics of Glossina fuscipes fuscipes from southern Chad. Zenodo, ver. 9 peer-reviewed and recommended by PCI Zoology. https://doi.org/10.5281/zenodo.7763870
WHO (2022) Trypanosomiasis, human African (sleeping sickness). https://www.who.int/news-room/fact-sheets/detail/trypanosomiasis-human-african-(sleeping-sickness), retrieved 17. March 2023
DOI or URL of the preprint: https://doi.org/10.5281/zenodo.5763206
Version of the preprint: 6
Rebuttal letter
Population genetics of Glossina fuscipes fuscipes from southern Chad
PCI Zool #127
Round #2
by Michael Lattorff, 09 Feb 2023 12:45
Manuscript: https://zenodo.org/record/7097648#.Yyn3rbTP1PY version 6
minor revision
Dear Authors,
although we were desperately trying to find reviewers, we managed to get only one review by one of the former reviewers. The review states that there is a significant improvement of the manuscript and only a few minor issues are left. I suggest you briefly incorporate them or justify in a rebuttal why you are not implementing them.
Answer:
We thank the recommender for his efforts in finding referees to evaluate our preprint. Please find below our answers to the different points raised by the referee.
Reviews
Reviewed by anonymous reviewer, 21 Nov 2022 00:10
I recommend accept with revisions because of the following reasons:
1) The authors have made some welcome changes. Removing the "alternative methods" for estimating surface area reduces confusion. Reorganizing the methods and results sections to match also improves the manuscript.
2) Difficult to explain is the norm. Limitations are a real part of any pop gen study, but it is the author's job to make each choice simple, logical and easily followed. As it is, this takes an unrealistic amount of effort to follow even for someone very familiar with population genetics studies in many different contexts and systems. Statements like "For Mandoul, subsites seemed to allow for" and "appeared to" is not appropriate scientific process. I am confused about this attitude throughout the manuscript and response to my review. Of course, methods should be justified with logic, previous findings, or empirical evidence that this is the most appropriate/accurate way to do things. I'm sure this is the intention, but it does not come accross clearly.
Answer:
We have replaced "seemed" and "appeared", wherever we found it, by more affirmative words.
For the other concerns, we did not really know what to do, except a deep re-reading of the manuscript, with new amendments for more clarity when necessary. We hope these will meet the referee's satisfaction.
In some cases, a statement such as "Logistical constraints, including ...abc..., made it necessary to... xyz..." where appropriate would help.
In other cases, wherever simplification and use of the same methods are possible (for example where you have data at the trap level at both Mandoul and Maro), I would recommend the authors simplify the process for the readers by using the same methods throughout, then add other methods where appropriate to the supplemental and explain what they added to interpretation.
Answer
We acknowledge that the structure of the data were heterogeneous in time and space, as regard to population structure and quality of the markers (presence or not of stuttering and/or of null alleles). Repeat of analyses, using different units for subsamples were undertaken to make sure we did not neglect the presence of an important ecological parameter or the absence of it. This was complicated by the fact that each zone presented its own characteristics to this respect. We have tried to present things as simply as possible, but the fact is that the situation in these tsetse populations is itself heterogeneous. For instance in Mandoul, what we defined as subsites appeared as the main subdividing factor. While in Maro, it was the trap. Nonetheless, population subdivision across the whole of each zone was very weak, with very important levels of gene flows. Estimates of effective population size computed within each of these levels (subsite or trap), probably corresponded to the total effective population size of each zone. This is why we also computed these statistics considering all flies within each zone as a single unit. Subdivision was important between Dokoutou and Timbéri. For Timbéri, subsites outputted a positive FST between them, though they did not provided a significant level of subdivision and isolation by distance. To get another measure of isolation by distance, we also tried to undertake this with subsites within Timbéri alone, as the scale between Timbéri and Dokoutou might have overestimated the signal. For the same reason, when several traps or subsites displayed small number of flies, we also undertook the isolation by distance between individuals. Most of the time, values indeed converged, which offered more confidence on our estimates.
Keeping a single method in the text and moving alternative methods in the appendix will not simplify much the text as the significant level of subdivision was never the same in Mandoul (subsites), Maro (traps) or Dokoutou-Timbéri (zones).
Finally, the statements such as "Genetic drift is expected to run fast in tsetse fly. Meaning that allele frequencies change quickly from one generation to the other. Estimates of gene flow can thus only be undertaken between contemporaneous samples" in the response reflects a style that came across in the manuscript as well. Instead of testing and demonstrating the foundation population structure and processes, the authors use "expectations" and assumptions that are probably very well founded but the reader should be made more a part of the process so they can see for themselves.
Answer
We have tried to explain better why we had to analyze each cohort independently. To highlight it even more, we have dedicated a new section on this issue, named " Temporal issues and population genetics analyses". We hope that this additional paragraph will meet the Referee's satisfaction.
I am not totally satisfied with the responses mostly because about half of my comments were either "not understood" or were responded to with more extensive explanations that do not fix the original problem of there being too many complicated/inconsistent analysis that take the reader a lot of effort to follow. I do believe these could be streamlined and made more consistent if the authors dedicated themselves to this.
Answer:
We apologize, but what the referee asked for was not always clear to us, and appears vague here.
As far as we remember, the "not understood" case was only found at one instance in our previous rebuttal. It concerned the NJTree that the referee found uninformative because unrooted. We think that we addressed this remark in a very clear and appropriate way.
We recognize that our article contains many analyses, because we analyzed many different aspects of the data and obtained many different results. We could have separated those into many different smaller articles, but this would have been at the expense of our ethical feelings. The paper has already been shorten substantially. Readers are not expected to read the paper in all its details. On the contrary, we believe that those interested in some aspects of it will pick what is relevant to them. This is why each zone was analyzed in a dedicated paragraph. The presentation was already streamlined by migrating a major part of the material and methods section, and the DAPC results in the appendix. We could move more of this in the appendix, keeping only the main results. However, this would be made at the expense of transparency or readability. Furthermore, readers are free to go straight to the main results that are provided at the end of the relevant paragraphs, and only the most skeptic ones may analyze more thoroughly what we did to obtain those. We have added a sentence regarding this aspect in the new paragraph "Temporal issues and population genetics analyses".
Unless the recommender ask us to do so, we preferred not to modify dramatically our manuscript. Nevertheless, and if really necessary, we are ready to cut the present paper into six independent manuscripts as described in the new paragraph "Temporal issues and population genetics analyses".
We hope our preprint is now suitable for recommendation and remain at the recommender's disposal to undertake any further modification or answer to any question that he might find necessary.
Sincerely
Thierry de Meeûs
, posted 09 Feb 2023, validated 09 Feb 2023Dear Authors,
although we were desperately trying to find reviewers, we managed to get only one review by one of the former reviewers. The review states that there is a significant improvement of the manuscript and only a few minor issues are left. I suggest you briefly incorporate them or justify in a rebuttal why you are not implementing them.
I recommend accept with revisions because of the following reasons:
1) The authors have made some welcome changes. Removing the "alternative methods" for estimating surface area reduces confusion. Reorganizing the methods and results sections to match also improves the manuscript.
2) Difficult to explain is the norm. Limitations are a real part of any pop gen study, but it is the author's job to make each choice simple, logical and easily followed. As it is, this takes an unrealistic amount of effort to follow even for someone very familiar with population genetics studies in many different contexts and systems. Statements like "For Mandoul, subsites seemed to allow for" and "appeared to" is not appropriate scientific process. I am confused about this attitude throughout the manuscript and response to my review. Of course, methods should be justified with logic, previous findings, or empirical evidence that this is the most appropriate/accurate way to do things. I'm sure this is the intention, but it does not come accross clearly.
In some cases, a statement such as "Logistical constraints, including ...abc..., made it necessary to... xyz..." where appropriate would help.
In other cases, wherever simplification and use of the same methods are possible (for example where you have data at the trap level at both Mandoul and Maro), I would recommend the authors simplify the process for the readers by using the same methods throughout, then add other methods where appropriate to the supplemental and explain what they added to interpretation.
Finally, the statements such as "Genetic drift is expected to run fast in tsetse fly. Meaning that allele frequencies change quickly from one generation to the other. Estimates of gene flow can thus only be undertaken between contemporaneous samples" in the response reflects a style that came across in the manuscript as well. Instead of testing and demonstrating the foundation population structure and processes, the authors use "expectations" and assumptions that are probably very well founded but the reader should be made more a part of the process so they can see for themselves.
I am not totally satisfied with the responses mostly because about half of my comments were either "not understood" or were responded to with more extensive explanations that do not fix the original problem of there being too many complicated/inconsistent analysis that take the reader a lot of effort to follow. I do believe these could be streamlined and made more consistent if the authors dedicated themselves to this.
DOI or URL of the preprint: https://zenodo.org/record/6477243
Dear Recommender,
Please find below our answer to your and referees' comments regarding our preprint:
Population genetics of Glossina fuscipes fuscipes from southern Chad
Sophie Ravel, Mahamat Hissène Mahamat, Adeline Ségard, Rafael Argiles-Herrero, Jérémy Bouyer, Jean-Baptiste Rayaisse, Philippe Solano, Brahim Guihini Mollo, Mallaye Pèka, Justin Darnas, Adrien Marie Gaston Belem, Wilfrid Yoni, Camille Noûs, Thierry de Meeûs.
We hope we have addressed all issues appropriately, but remain at your disposal for any question or suggestion you might in necessary.
Best regards
Thierry de Meeûs
Round #1
by Michael Lattorff, 13 Jul 2022 08:40
Manuscript: https://zenodo.org/record/6477243
Major revision
Comments from the Recommender
Dear authors,
the manuscript (pre-print) has been reviewed by two experts in the field. While one reviewer is not familaiar with all the methodology, the second reviewer is very critical about the methods, which are insufficiently described and differ a lot between sampling locations, which makes comparisons very difficult. You should clearly outline, why sampling was done differently and how comparisons can be done or not. It certainly needs an extensive rework of the methods and results section, which might also have serious implications for the discussion and conclusions.
Answer of authors
We have tried to enhance the description of sampling in the different zones and why some of those were not sampled at the same time in the material and methods section. We also have added more comments on the differences in size and densities, which are indeed very different, and we discuss these differences. You will see more detailed explanations in the detailed rebuttal below. For other points raised, we have taken into account both referees' remarks and hope that our preprint is now suitable for recommendation.
Reviews
First review
Referee 1
L1 Avoid columns in the engaging sentence and I suggest to say’’ Tsetse flies (genus Glossina) are vectors of Human African Trypanosomosis (HAT) and Animal African Trypanosomosis (AAT) where they transmit the deadly trypanosomes to human populations and domestic animals in sub-Saharan Africa’’.
Answer of authors
We have modified the corresponding sentence following Referee 1's suggestion, with some small modifications that we hope will meet her/his satisfaction.
Referee 1
I suggest to Singularize the word ‘’Trypanosomosis’’ and instead say Trypanosomiasis.
Answer of authors
We have modified "Human African Trypanosomosis" into "Human African Trypanosomiasis".
Referee 1
L78 Delete ‘’ e.g.’’ and make just the reference
Answer of authors
Done
Referee 1
L479 was the correlation between Hs and GST necessary when we already have F-statistics which is more accurate?
Answer of authors
The reason for this correlation test is given in the "Material and methods" section, subsection "Global subdivision". This is Wang's criterion. It allows deciding how to correct FST for excess of polymorphism. Meirmans' FST', when the correlation is negative or Meirmans and Hedrick's GST" otherwise.
Referee 1
L586 A part from FCA), DAPC, why not try to use Migrate to Estimating migration rates between populations and also establish distance matrix between sites, using the geosphere package in R.
Answer of authors
We did not use FCA and DAPC (and also NJTree) to estimate migration rate. These tools were used to illustrate the more or less intense subdivision between the different samples as regard to spatial and temporal factors. Migration rates, or more exactly immigration rates, were estimated from FST based models, after this parameter was corrected for stuttering, the presence of null alleles and excess of polymorphism. The software MIGRATE, as far as we know, does not correct for null alleles, and this would probably generate inaccurate estimates of immigration.
Second review
Referee 2
I do not recommend this paper for publication in its current form. Please find my comments below. The comparison among zones is not possible given the sampling differences and inconsistency of methods. The aims of the paper need to be adjusted as such, and interpretation of results should avoid direct comparisons of results among these different zones unless methods are applied uniformly.
Major Comments:
1) Surface (S) estimates are problematic. Although this is not well described in a cohesive way in the manuscript, I have interpreted that there were at least 5 different methods used to estimate S.
- Method “a” small spatial scale (for Dokoutou): In the methods on pg. 6 “For Dokoutou, traps were deployed in a very short portion (213 m long) of the forest gallery. The attractive cone of a trap is known to be much bigger than that, i.e. with a radius of 200 m (Bouyer et al., 2015). We thus considered that the surface of this site was defined by the length of the sampling zone (i.e. 213 m) plus twice the radius of the attractive cone (i.e. 2×200), hence 613 m, and a width corresponding to twice this radius, hence 400 m. This led to a surface of 0.2452 km2.”
- Method “b” large spatial scale (for Mandoul, Maro, Timberi): In the methods on pg. 6 “the surface of the polygon defined by the traps with at least one fly (Sp). Except for Dokoutou, this surface was computed with Karney's algorithm (Karney, 2013) with the package geosphere (command areaPolygon) (Hijmans et al., 2019) for R (see appendix 1).”
- Method “c” small spatial scale (for subsites of Mandoul, Maro, Timberi): In the results section pg. 16 there is reference to this but we are not given a complete description of how this was done “The average surface of subsites was Ssubsites=3304 m2, and it was SMandoul=32 km2 for the whole focus. This led to very different effective population densities: De-subsites=15111 in minimax=[2784, 46288] individuals/km2, and De-Mandoul=4.4 in minimax=[0.3, 8.5] individuals/km2.” My assumption was that this was done with areaPolygon without accounting for the radius of the attractive cone as in method “a”.
- Method “d” mid spatial scale (for Dokoutou and Timberi): In the methods section pg. 10 “surface SDokoutouTimbéri was assumed to correspond to the disc defined by the distance between these two zones (Dgeo) as the diameter of this disc, i.e. SDokoutouTimbéri=π×(Dgeo/2)2.”
- Method “e” large spatial scale (for Timberi in Table 3 only): In the results section pg. 18: “The surface (S) of Timbéri, in km2, was computed with geosphere for R and as described in the Material and Methods section for Dokoutou.”
The methods used to estimate S are thus: Inconsistent across scales (e.g. methods “a” versus “b”). Inconsistent within scales (e.g. methods “a” versus “c”). Illogical at the largest scale (i.e. method “b”) since this area polygon method arbitrarily includes unsampled area and does not account for the radius of the attractive cone around the traps. Illogical at the mid-scale (i.e. method “d”) since this also arbitrarily includes unsampled area. And finally, the methods are not clearly described (e.g. method “c” and “e” are not described in the methods, method “e” is only mentioned in the caption for Table 3, it is not clear what the estimates are used for in subsequent analysis). Estimates of S from these confusing, illogical, and inconsistent estimates of S were then presumably (but not clearly stated to be) used to estimate Dt, De, and δ, thereby making these estimates and all conclusions drawn from them also unreliable. For example, in the abstract: “Apparent density and effective population density appeared smaller in the main foci of Mandoul and Maro and the average dispersal distance (within the spatial scale of each zone) was as large as or larger than the total length of each respective zone.” The comparison of Dt, De and δ among zones is unfounded given the inconsistency in the methods for estimating S, which is the denominator in Dt and De and directly impacts δ.
2) Lack of accuracy in De issue stated on pg. 11 compounds this problem of inaccuracy and inconsistency in estimates of S. Pg 11 states “ In any other case, like skewed distributions (right or left), or platykurtic distributions, δ will be slightly overestimated. Since there is also a lack of accuracy for De, δ corresponded more to an order of magnitude than a precise estimate of dispersal distance.” But, adding to this the problem with inconsistency and confusion in how S is estimated, this makes the estimate of De and thus δ so inaccurate that it is not useful in interpretation of biologically relevant patterns or processes.
Answer of authors to points 1 and 2
We acknowledge that the situation is difficult to explain. This directly comes from logistic constraints. Mandoul and Maro, which are both HAT foci, had to be sampled once, just before control began, to provide the “T0” entomological situation that will then be monitored regarding tsetse densities during control, to measure the efficacy of the control campaign. Each thus needed to be studied one at a time. Then Timbéri and Dokoutou, where no HAT case was ever reported, could be sampled, each during the same season, because no control measures have been planned there. The four zones are quite remote from each other's, and especially temporally speaking. Genetic drift is expected to run fast in tsetse fly. Meaning that allele frequencies change quickly from one generation to the other. Estimates of gene flow can thus only be undertaken between contemporaneous subsamples. So, except for Dokoutou and Timbéri (same cohort), that could be studied together, each zone needed a specific analysis.
Estimating effective population sizes requires, as much as possible, as many replicates as possible. For Mandoul, subsites seemed to allow for this, while in Maro, traps appeared more accurate. In any case, we also showed that there was almost panmixia within these zones. Consequently, wherever the scale (subsite or trap) we worked in, and whatever the method used, this necessarily provided independent estimates of effective population size of the whole zone. The most accurate estimate of Ne was then the average across subsamples (subsites of traps) and methods (LD, coancestries, Estim or FIS). In Timbéri, globally panmictic and with small number of individuals (19), the whole zone was used. Dokoutou is obviously a single isolated and panmictic population that occupies a very small surface.
Following these characteristics, except for Dokoutou (see below), the surfaces where tsetse flies could be found were very well and precisely defined by the surface occupied by traps that captured at least one fly, and this cannot be questioned. We tried other alternatives that provided inconsistent results. We have now deleted these attempts following the reviewers' comment because they obviously brought more confusion than anything else. Effective population densities were thus simply computed as the average Ne divided by the surface where tsetse flies can be found, within each zone. Dokoutou is a small site with very dense vegetation where the personnel experienced important problems to install the traps. It was thus obvious that not all the surface occupied by flies was sampled. This is why we adjusted the surface according to the advice of experts in tsetse trapping. This led us to extend the surface to 200 m on each side of the rectangle defined by the position of the traps (to the East, West, North and South). The resulting rectangle actually approximatively fits well the "green-thick" forest landscape that one can notice from the sky with GoogleEarth pro. We could have extended this area a little more, so that all green areas would be contained in this extended rectangle, but without any other argument as compared to the expert opinion. Moreover, extending the rectangle corresponding to Dokoutou would have not change the conclusion (very big effective population density in Dokoutou).
We thus think that estimates of effective population densities were the most possible accurate one could have computed.
Regarding estimate of dispersal, we used, whenever possible, different and sometimes quite independent methods.
Within Mandoul, Maro and Timbéri, we could use the slopes of isolation by distance between subsamples (traps or subsites), or between individuals. Between Dokoutou and Timbéri, we could use the slope of isolation by distance between traps. We also used the general subdivision level between the two zones, using Meirmans' FST_max and FST_FreeNA (corrected for null alleles): FST'=FST_FreeNA/FST_max. We could then estimate Nem=(1-FST')/(8FST') to infer m from which we also could infer the dispersal distance δ=mDDT; where DDT is the average distance between the two zones.
As one can check in the "Results" section, all dispersal distance estimates converged to the same values in order of magnitude, within each system (which is independent from the others). The convergence was very accurate in the Dokoutou-Timbéri system, between very different methods of estimate. This clearly validated the methods used.
We have tried to explain all this more clearly in the manuscript and hope this will meet Referee 2's satisfaction.
Referee 2
3) Definition of “focus” is not clear. Is this synonymous with “zone”? Or something different? This causes confusion throughout, starting in the abstract. Define it in the section “Structure of the data” or elsewhere.
Answer of authors
Referee 2 is right. The word “focus” only applies to Mandoul and Maro because “focus” is used only in areas that harbor HAT. We have replaced it by "zone", except when describing the situation in these HAT foci.
Referee 2
4) Ne estimates are uninterpretable when averaged as presented (e.g. Table 6). Averaging methods are not logical: a) Averaging the lower 95% confidence interval for some sites but not all does not allow for comparison among the 4 zones. I am referring to pg. 18 “The lowest value of 95% confidence intervals was used to compute averages when nothing else was available.” b) For Mandoul, the method of taking the “average effective population size over subsites multiplied by the number of subsites” is illogical given the definition of S in this instance as the "areaPolygon". If you use “areaPolygon”, then there is a lot of unsampled area that should presumably contain tsetse flies at a similar density as the places where you placed traps, which does not get accounted for in your calculation.
Answer of authors
Whatever the method used, infinite values, which reflects very big effective population sizes, cannot be used in the computations. We thus insisted on the fact that Ne will always be an underestimate.
Regarding the issue of averaging across methods: We are sorry not being able to follow Referee 2 on that matter. Giving all possible values obtained would be very confusing and impossible to interpret. We need an average value to compute effective population densities. We also computed averages of maximum and minimum values obtained to get a large range of possible values.
Subpoint a, using lower bounds of 95%CI: We did not use 95%CI of Ne except when the average was unavailable (infinite), and this only occurred for Dokoutou and Timbéri. In Dokoutou, only one Ne was available (12.1) and in Timbéri, only three Ne (91.7, 12.8 and 3.6) could be computed (other values were infinite). Using the lower bound, in case of infinite Ne, allowed getting more values that considerably extended the range of possible values, and in particular to higher limits: 12.1 to 117.3 for Dokoutou; 0 to 91.7 for Timbéri.
Subpoint b: As explained above, we have deleted the section where alternative methods are used to compute effective population densities. For Mandoul, Maro and Timbéri, we know that the area delimited by the traps that captured tsetse flies correspond to the actual surface occupied by tsetse flies in each of these zones (S). Because of the very high levels of dispersal within each zone, effective population sizes estimated in any subsample (subsite or trap), within each zone, will necessarily represent independent estimates of the global effective population size (Ne), so that De=Ne/S should be accurate enough.
This is typically empirical population genetics. We do what we can, with what we have, all ending in rough estimates. Nevertheless, estimates made from whole samples reasonably converged with subsample-based estimates, which provided some confidence.
We have tried to explain all this in a way that we hope Referee 2 will find clearer.
Referee 2
5) “Sub-site” versus “subsite”. Choose one term and use this throughout. Also define it in the section “Structure of the data”, subsite is not listed. In Table 2 subsite is the most important level for Mandoul, yet we don’t know what subsite means from the methods.
Answer of authors
Now it is subsite everywhere in the amended manuscript. Subsite was already defined in the "Material and methods" section, in the paragraph "structure of the data": "…subsite as defined in the Figure 1 (gathering traps that were less than 400 m apart)". We also have added a reference to Figure S2, where traps composing the different subsites are easily seen.
Minor Comments:
Referee 2
6) Methods organization should be improved, with subheaders that are linked to the subheaders in the results section to make it easier to follow. All methods need to be included in the methods sections, right now some are peppered throughout the results.
Answer of authors
Referee 2 is right and we amended the "M&M" section and the "Results" section, with new subheadings, following the exact same order in both sections.
Referee 2
7) Quality of the map figures are often poor. I cannot understand Fig 4 (it is visually confusing and unpleasing, and the caption says there are regions displayed, but the dotted lines do not connect to form regions).
Answer of authors
We have modified the figures containing maps (Figures 1 and 4) and hope these will now meet Referee 2's satisfaction.
Referee 2
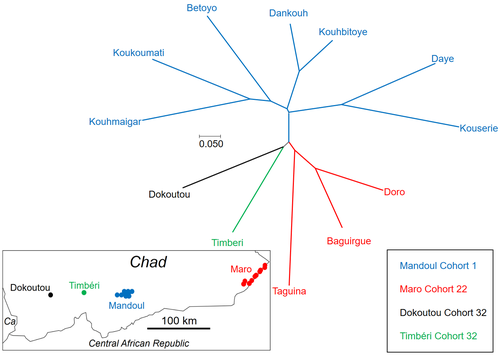
8) The NJ tree is not very informative given that it is unrooted, it is a summary from many pairwise estimates of CSE, and you have such uneven sampling among the four zones.
Answer of authors
We are sorry here but we do not really understand this remark. Figure 3 is not aiming at presenting a phylogenetic tree. The objective was to illustrate the genetic similarities between the different sites as regards to temporal and spatial distances. None of the sites can be the root. The structure of this network reflects well what is written in the text: sites are first separated by the temporal distance between Mandoul and the rest, and then by geographic distances. The Mantel test confirmed this. The different colors (zones) never mix, so we cannot see what Referee 2 means by "uneven sampling".
, posted 13 Jul 2022Dear authors,
the manuscript (pre-print) has been reviewed by two experts in the field. While one reviewer is not familaiar with all the methodology, the second reviewer is very critical about the methods, which are insufficiently described and differ a lot between sampling locations, which makes comparisons very difficult. You should clearly outline, why sampling was done differently and how comparisons can be done or not. It certainly needs an extensive rework of the methods and results section, which might also have serious implications for the discussion and conclusions.
The invitation to revise the manuscript is not a guarantee of final recommendation.
Kind regards
Michael
